Default
Just display a representation of binary data.
pixelchart draw test.csv test.png -w 100 -h 100 -s 3

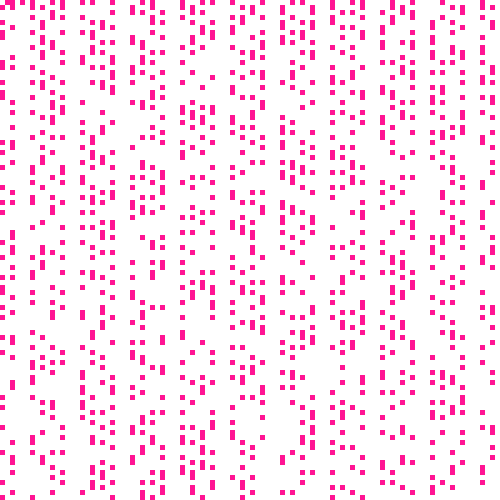
Prime numbers
A representation of prime numbers under 10,000.
require 'pixelchart'
require 'prime'
primes = (1..10000).map{ |i| Prime.prime?(i) }
= {
colors: [[255,255,255],[255,20,147]],
scale: 5
}
im = PixelChart.new(primes, 100, 100, )
im.draw('primes.png')

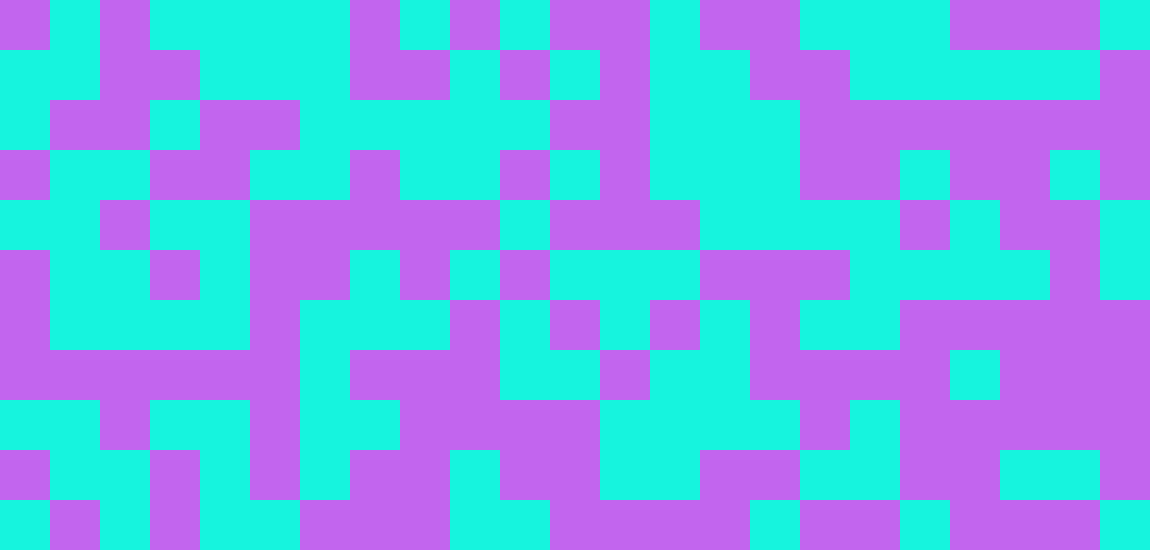
Malware hash
Create a unique fingerprint image for a malware (eg. VirusTotal).
require 'pixelchart'
require 'ctf_party'
sha256 = '142b638c6a60b60c7f9928da4fb85a5a8e1422a9ffdc9ee49e17e56ccca9cf6e'.hex2bin.split('')
sha256.map! { |x| x.to_i }
= {
colors: [:random,:random],
scale: 50
}
im = PixelChart.new(sha256, 23, 11, )
im.draw('virus.png')

Random data
Create an image with random data, for example for a default profile image on a forum.
require 'pixelchart'
data = (0 ... 10000).map {|_i| rand(2) }
= {
colors: [[0,255,127],[0,0,0]],
scale: 5
}
im = PixelChart.new(data, 100, 100, )
im.draw('random.png')

The logo
The PixelChart logo was designed pixel by pixel on a 7*7 square.
░▓▓▓▓▓░
░░▓░▓▓░
░░▓░░▓░
░░▓▓▓▓░
░░▓░░░░
░░▓░░░░
░░▓░░░░
Then convert black and white pixel to 1 and 0.
0,1,1,1,1,1,0
0,0,1,0,1,1,0
0,0,1,0,0,1,0
0,0,1,1,1,1,0
0,0,1,0,0,0,0
0,0,1,0,0,0,0
0,0,1,0,0,0,0
Inline.
0,1,1,1,1,1,0,0,0,1,0,1,1,0,0,0,1,0,0,1,0,0,0,1,1,1,1,0,0,0,1,0,0,0,0,0,0,1,0,0,0,0,0,0,1,0,0,0,0
Then map the data and choose some colors.
require 'pixelchart'
data = [0,1,1,1,1,1,0,0,0,1,0,1,1,0,0,0,1,0,0,1,0,0,0,1,1,1,1,0,0,0,1,0,0,0,0,0,0,1,0,0,0,0,0,0,1,0,0,0,0]
= {
colors: [[0,0,0],[0,255,127]],
scale: 30
}
im = PixelChart.new(data, 7, 7, )
im.draw('logo.png')
Tada! The logo is done!
